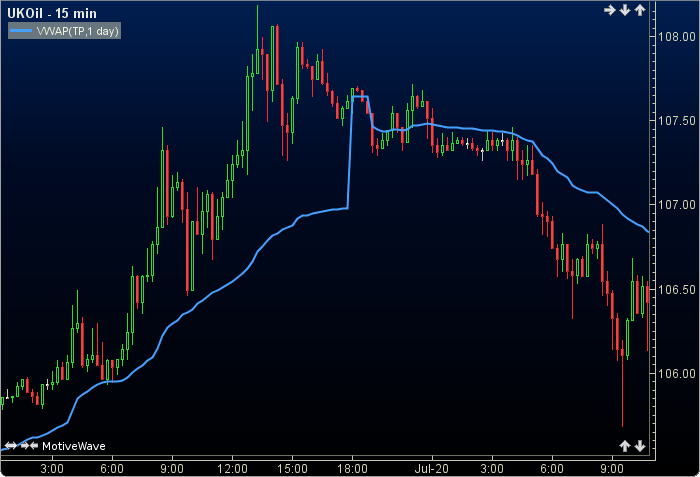
Volume Weighted Average Price (VWAP) is a technical analysis tool used by traders and investors to measure the average price of a security over a specific period, taking into account both price and trading volume. The VWAP chart is calculated by adding up the total dollar value traded for a security and dividing it by the total trading volume over a specific time frame. This allows traders to see the average price at which a security has traded throughout the day, helping them make informed decisions based on market trends.
Traders use the VWAP chart to identify potential support and resistance levels, determine market trends, and gauge the fair value of a security. By comparing the current price of a security to its VWAP, traders can assess whether the security is trading above or below its average price, indicating whether it is overbought or oversold. This information can help traders make more informed trading decisions and manage their risk more effectively.
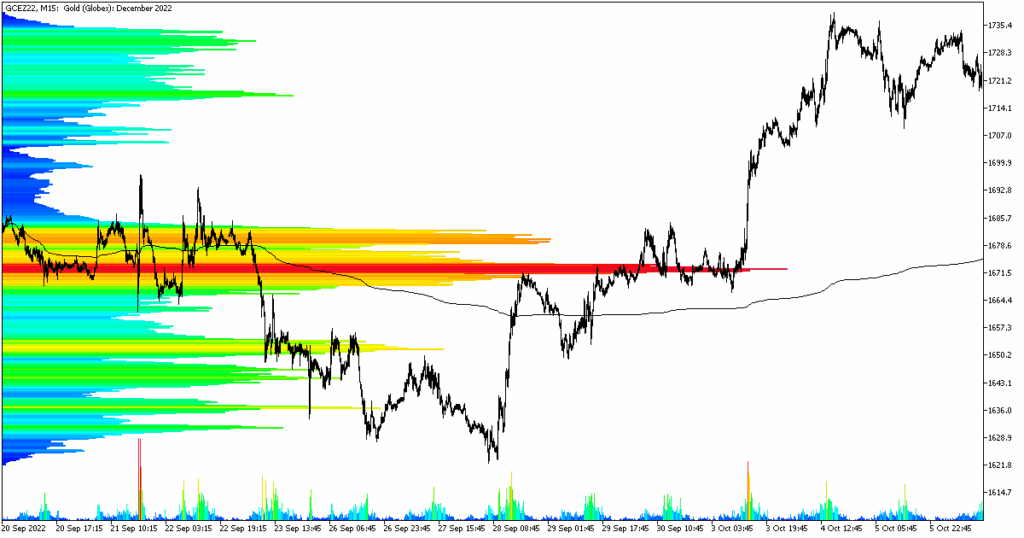
Volume Weighted Average Price Chart
How to Interpret a Volume Weighted Average Price Chart
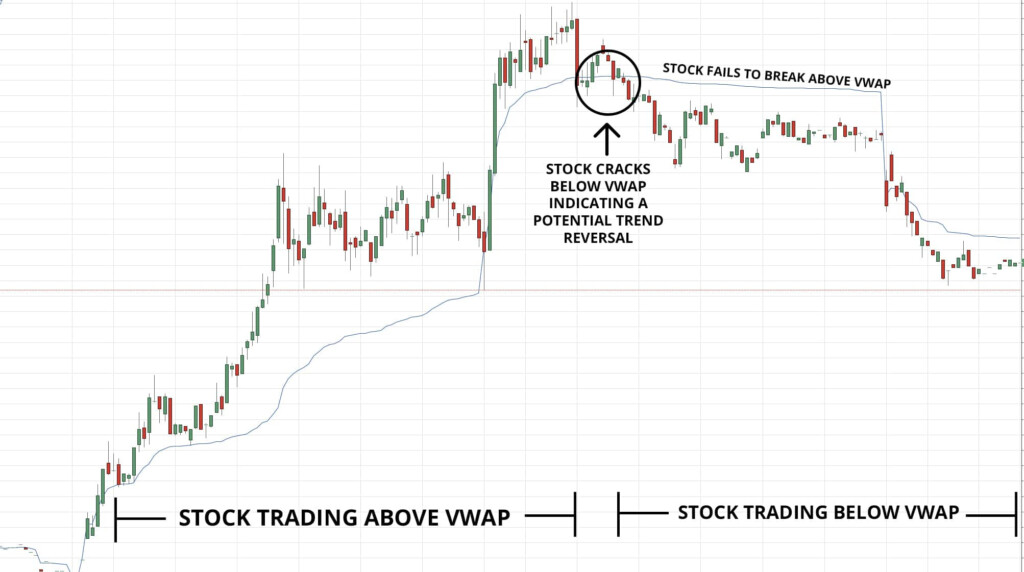
When analyzing a VWAP chart, traders should pay attention to how the current price of a security compares to the VWAP line. If the price is above the VWAP, it may indicate that the security is overvalued and could be due for a correction. On the other hand, if the price is below the VWAP, it may suggest that the security is undervalued and could be a buying opportunity.
Traders can also look for convergence or divergence between the price and the VWAP line to identify potential trend reversals. If the price is trending in the opposite direction of the VWAP line, it could signal a change in market sentiment and a potential shift in the trend. By using the VWAP chart in conjunction with other technical indicators, traders can gain a more comprehensive view of market trends and make more informed trading decisions.
Benefits of Using Volume Weighted Average Price Chart
One of the key benefits of using the VWAP chart is its ability to provide a more accurate representation of the average price of a security by taking into account both price and volume. This can help traders avoid getting misled by short-term price fluctuations and make more informed trading decisions based on the overall market trend.
Additionally, the VWAP chart can help traders identify potential entry and exit points by showing them where the current price stands relative to the average price of the security. This can help traders optimize their trading strategies and manage their risk more effectively. By incorporating the VWAP chart into their technical analysis toolkit, traders can gain a better understanding of market trends and make more profitable trading decisions.
Download Volume Weighted Average Price Chart
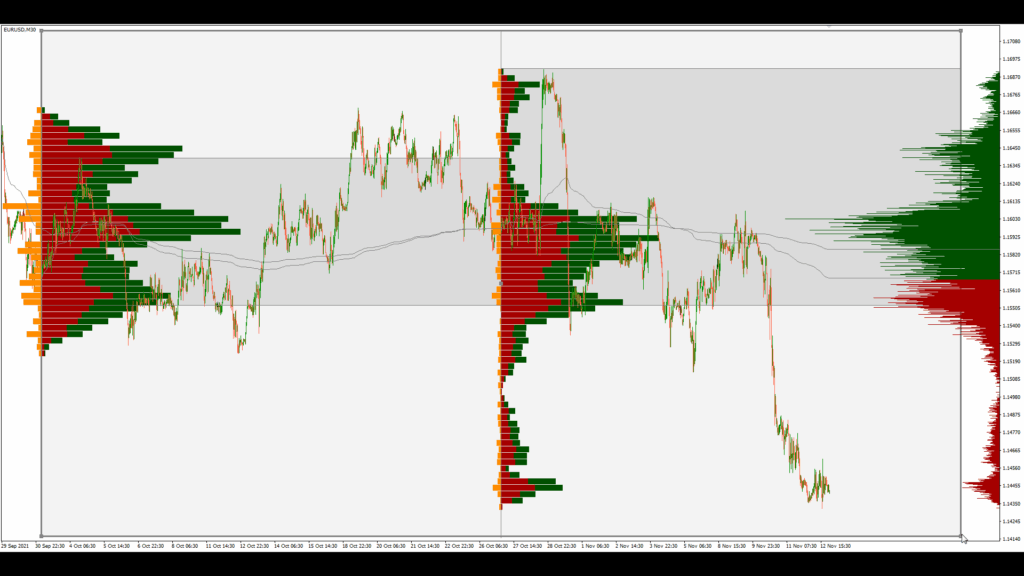
Market Profile TPO Histogram And Volume Weighted Average Price
Volume Weighted Average Price VWAP Definition
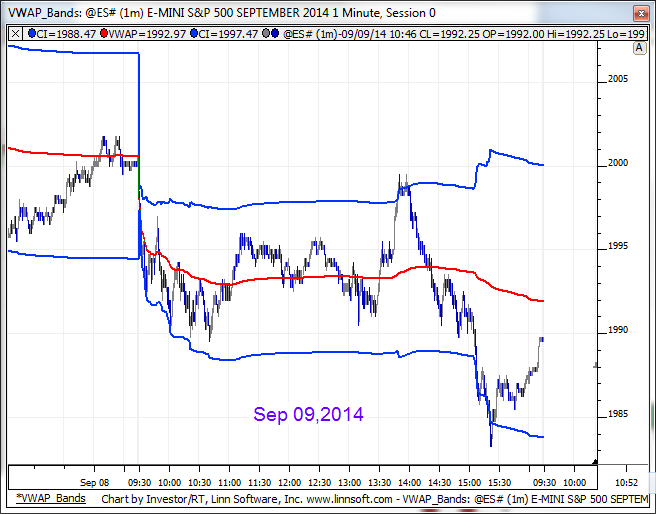
Volume Weighted Average Price VWAPI Linn Software
Volume Weighted Average Price VWAP
